One day I asked myself the above question and wanted to get an answer to it so I started this project. But where to start , I had to gain knowledge about various aeronautic topics despite knowing how a plane works in general. A friend who back then started to take flying lessons told me that there is a thing called ADS-B and a bit of search gave me the exact results I wanted. Automatic Dependent Surveillance - Broadcast short ADS-B is a surveillance technology to keep track of every aircraft and its current attributes. So basically every Aircraft calculates its position via GPS and broadcasts this with additional data at 1,097 kHZ . The additional data features a lot more then only the position but also the flightnumber, Aircrafttype, Localtime, Speed, Altitude, Tracking, etc. The signal is transmitted every second and has a range of ~370 km. While traveling with an aircraft 370km is not that far also over the oceans there is no ground station to receive the information so the signal can be send to Satelite-UAT which then relays it to a groundstation or other planes further away.
There are a lot of ADS-B receivers available from the 100EUR DIY PCB with RS-232 communication to 1000EUR High End Industry Standard USB Dongles. Basically all work the same and Europe is covered around 90% with 500+ active receiversdue to its DIY-Community. I found some websites when I looked around for sources of data since I did not want to taper around with receiving the signal on my own.
The websites I found use JSON to parse the data to their frontends so I just had to scrape it. This data then got pickled into a huge binary blob for the next step. Filtering and Pre-Processing After receiving the data and taking a first look on it I noticed strange values. And after the first rendernings I knew there where errors. Alot of the records had transmission errors of various kinds in it. Some planes had multiple locations , where flying with the speed of light , where passing thru a hole in the sky or just popped out of nowhere. To make now sence out of the data I created "logbooks" for every flight.
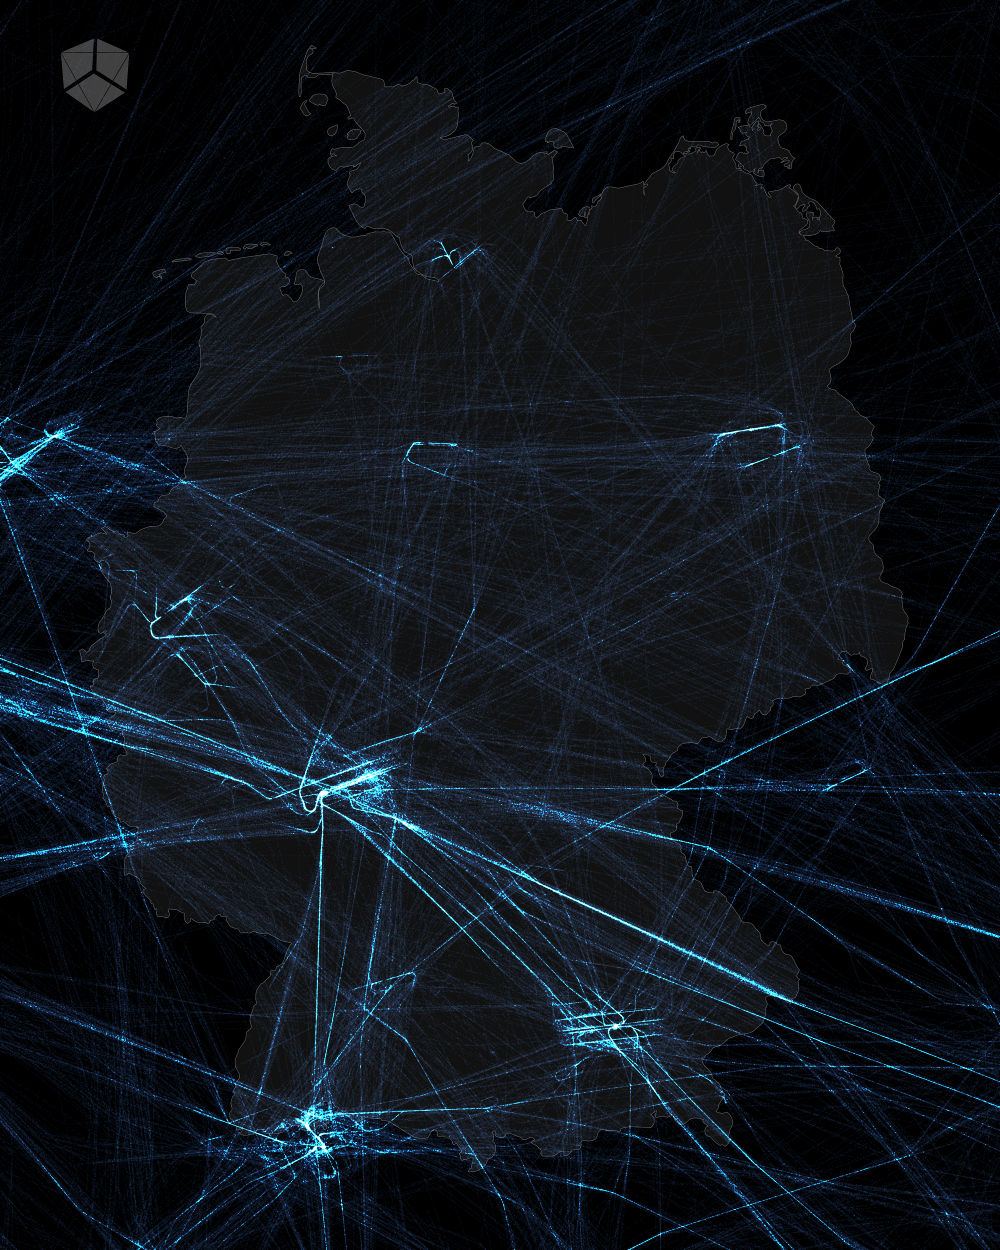
To make any sense out of the GPS coordinates from the records I had to unproject them on a 2D Surface using Mercator Projection. So that for example 52"'32'33; 13"23'12 maps to the pixel (432,322) which could then be plotted on an image. Now I could start to plot flights and experiment with color by height, speed or random color for every flight and stuff like this. Below you can see some "long exposure" shots of the german airspace.
After seing how much planes were flying to their destinations I wondered about how dense some airspace might be and created a heightmap over germany.